
September 28, 2023/FBNQuest Research
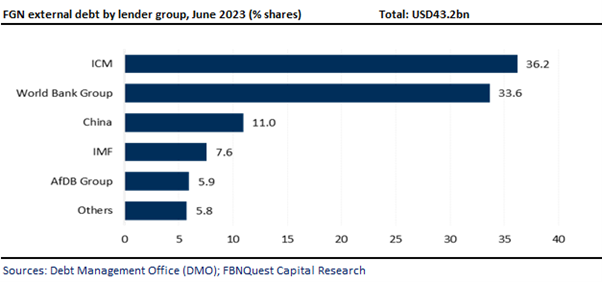
According to the Debt Management Office (DMO), the Federal Government of Nigeria’s (FGN) total external debt obligations increased by USD488m from the previous quarter to USD43.2bn in Q2 ’23. The q/q rise in the external debt stock was primarily due to increases of USD390m and USD183m in loans obtained from China and the World Bank, respectively. These more than offset a total loan reduction of USD86m owed to various other lenders, including a USD38m loan from the IMF. On the basis of standardized metrics, the total external debt is estimated at around c.11.3% of 2023f GDP.
Notably, while the external debt obligations increased only modestly in USD terms q/q, their value in naira terms rose significantly to NGN33.2trn from NGN19.6trn in Q1 ’23 due to the >40% downward adjustment of the naira in H1 ’23.
The debt stock comprises both the external borrowings of the federal government and those of state governments, for which the federal government typically provides sovereign guarantees.
In terms of the split, the FGN’s direct external debt obligations amounted to USD38.8bn, while the balance of USD4.3bn was debt owed by the state governments.
Almost 61% of the federal government’s external debt is owed to multilateral and bilateral lenders, mostly on concessional terms. This compares with about to around 60.5% in Q1 ’23.
In its 2023 budget, the FGN envisaged total external borrowings of NGN1.8trn (c.USD2.4bn) to fund part of its budget deficit. We note that this amount was much higher, at c.USD3.9bn based on the prevailing exchange rate at the time.
However, as at H1 2023, total external borrowings increased by USD1.4bn. Notably, the commercial debt stock has remained relatively stable, primarily due to the monetary policy tightening adopted by most central banks.
Looking ahead, we do not anticipate a substantial increase in the external debt stock due to the difficulties in raising commercial debt during this period.