

July 31, 2026/Cordros Report
International Breweries Plc (INTBREW) released its Q2-26 unaudited results after close of business yesterday (30 July), reporting a 57.0% y/y increase in EPS to NGN0.11 (Q2-25: NGN0.07), bringing H1-26 EPS to NGN0.23, (-7.2% y/y). The quarterly earnings growth was driven by a 380bps y/y expansion in EBIT margin to 18.5% and a 120.0% y/y increase in net finance income, which more than offset the 2.4% y/y decline in revenue.
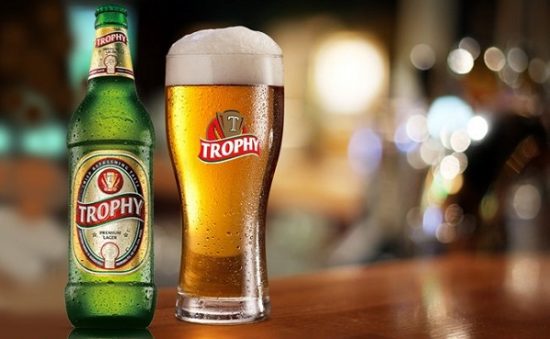
INTBREW’s revenue declined by 2.4% y/y in Q2-26 (H1-26: +0.3% y/y), reflecting the fading impact of prior price increases, with volume recovery yet to gain sufficient traction. Based on our channel checks, Trophy remained the primary growth driver, while Flying Fish continues to record weak off-take, resulting in elevated distributor inventory levels. On a quarter-on-quarter basis, revenue declined by 8.6%.
Gross margin expanded by 350bps y/y to 40.5% in Q2-26 (H1-26: +565bps y/y to 41.3%), as cost of sales declined faster (-7.8% y/y) than revenue. The decline was led by materials consumed and allocated overheads (-12.3% y/y | 57.9% of total costs), reflecting softer input costs, a stable exchange rate during the period, and lower production volumes, given that the decline in materials consumed outpaced the revenue contraction.
Similarly, EBIT and EBITDA margins expanded by 384bps y/y and 605bps y/y to 18.5% and 30.3%, respectively (H1-26: +399bps y/y and +586bps y/y to 20.4% and 31.5%, respectively), despite a 10.4% y/y increase in operating expenses (H1-26: +19.0% y/y). OPEX growth was driven by higher advertising, promotion & distribution expenses (+10.4% y/y), and employee benefit expenses (+13.8% y/y). However, we note that the OPEX-to-sales ratio deteriorated by 249bps y/y to 21.5% in Q2-26 (H1-26: +323bps y/y to 20.6%), indicating that margin expansion was driven by input cost deflation rather than operating discipline.
Below the operating line, net finance income surged by 120.0% y/y in Q2-26, as the 99.2% y/y increase in finance income more than offset the 78.4% y/y increase in finance costs. The growth in finance income was driven by a larger short-term investment portfolio, which expanded to NGN115.80 billion (Dec-25: NGN72.77 billion), alongside higher investment yields. Meanwhile, the increase in finance costs primarily reflects higher interest expense on lease liabilities (+92.2% y/y). In H1-26, net finance income declined by 10.3% y/y to NGN4.91 billion.
Ultimately, profit before tax increased by 30.3% y/y in Q2-26, while profit after tax rose by 57.0% y/y, further supported by a lower effective tax rate of 45.8% (Q2-25: 55.0%). For H1-26, PBT grew by 21.6% y/y, but PAT declined by 7.2% y/y, as the effective tax rate settled at 48.8% (H1-25: 32.9%).
Comment: INTBREW delivered a mixed Q2-26, posting the first topline contraction since the recapitalization, while easing input costs and stronger finance income supported margins and earnings. The weaker revenue performance suggests that the contribution from pricing is normalising, while volume recovery remains nascent. Looking ahead, we expect revenue to remain under pressure, although easing input costs and continued finance income should continue to support earnings. Nonetheless, softer-than-expected volume recovery, lower yields on the investment portfolio, higher lease-related finance costs and a rising cash tax burden remain the key downside risks to our outlook. Our estimates are under review.
